
This guide covers everything you need to get value from Core Temp, from your first launch to logging, alerts and plugins. If you have not installed it yet, start on the download page.
Getting Started
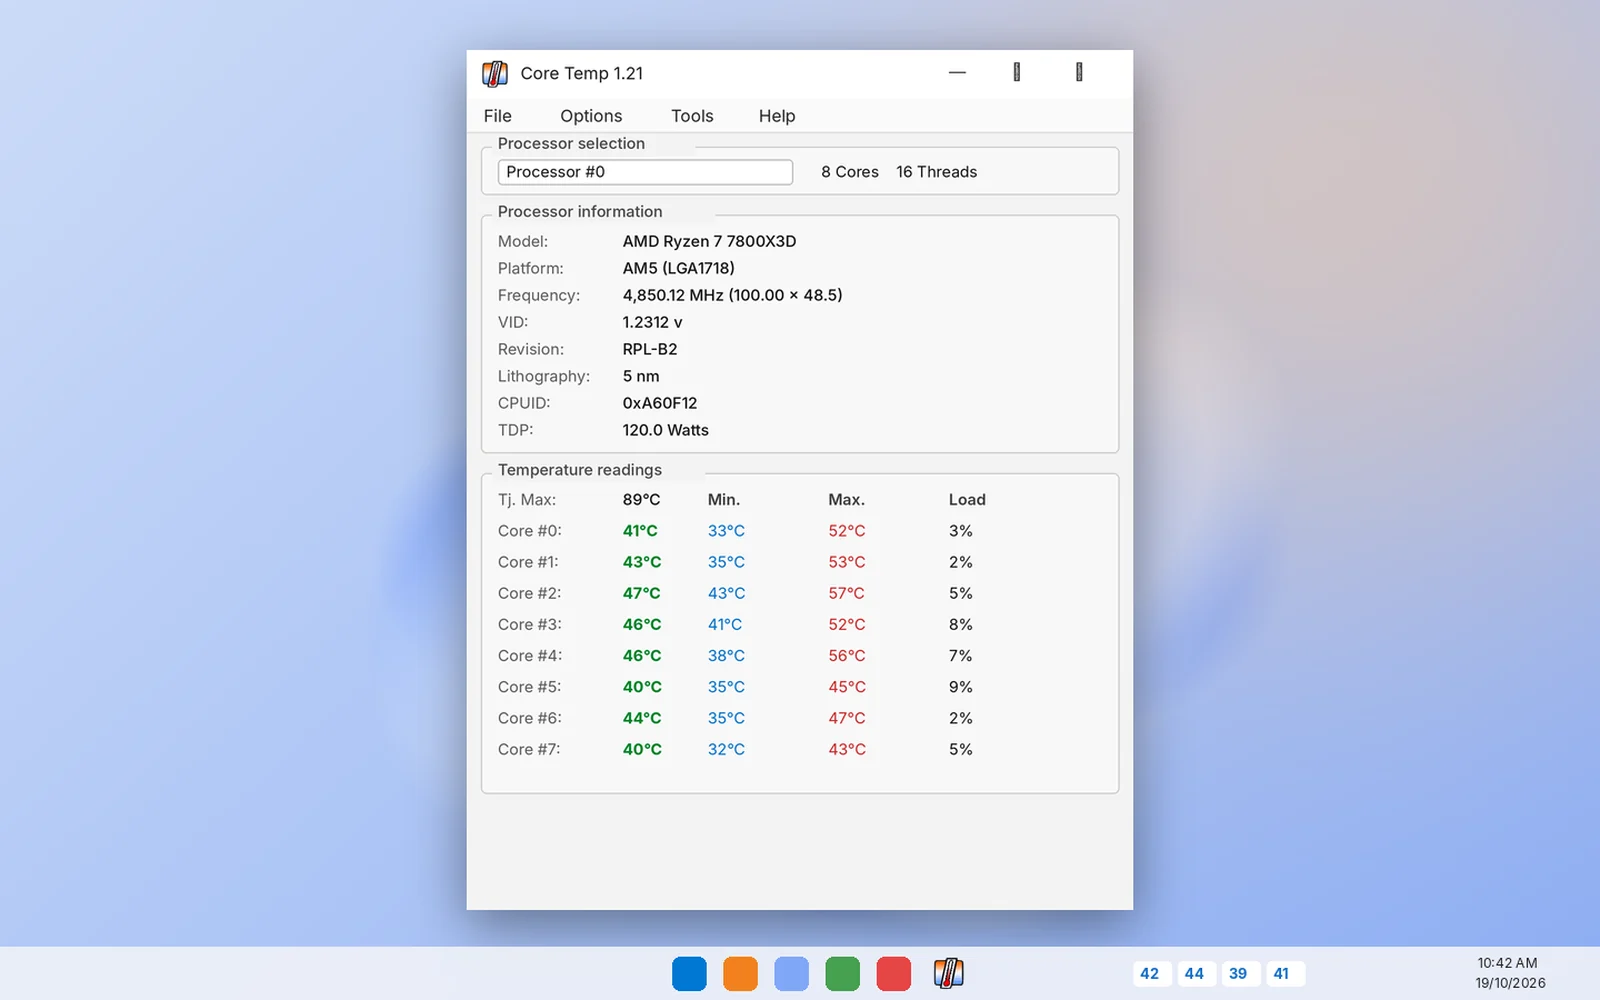
After installation, open Core Temp from the Start menu. Windows asks for administrator permission because the program loads a small driver to read CPU sensors. Within a second the window fills with your processor's details and a row of temperatures, one per core.
The Main Window
The Processor information panel shows model, platform, frequency, VID, revision, lithography, CPUID and TDP. The Temperature readings panel lists Tj. Max followed by each core's current temperature, its minimum and maximum since launch, and its load. For a field-by-field walkthrough, read how to read Core Temp.
Settings Explained
Open Options › Settings. The most useful options are:
- Polling interval: how often readings refresh. One second is the default; two or three seconds is plenty for most users.
- Logging interval: how often a line is written to the CSV log when logging is on.
- Start Core Temp with Windows and Start minimized for always-on monitoring.
- Display: switch between Celsius and Fahrenheit, or show distance to Tj. Max.
Notification Area
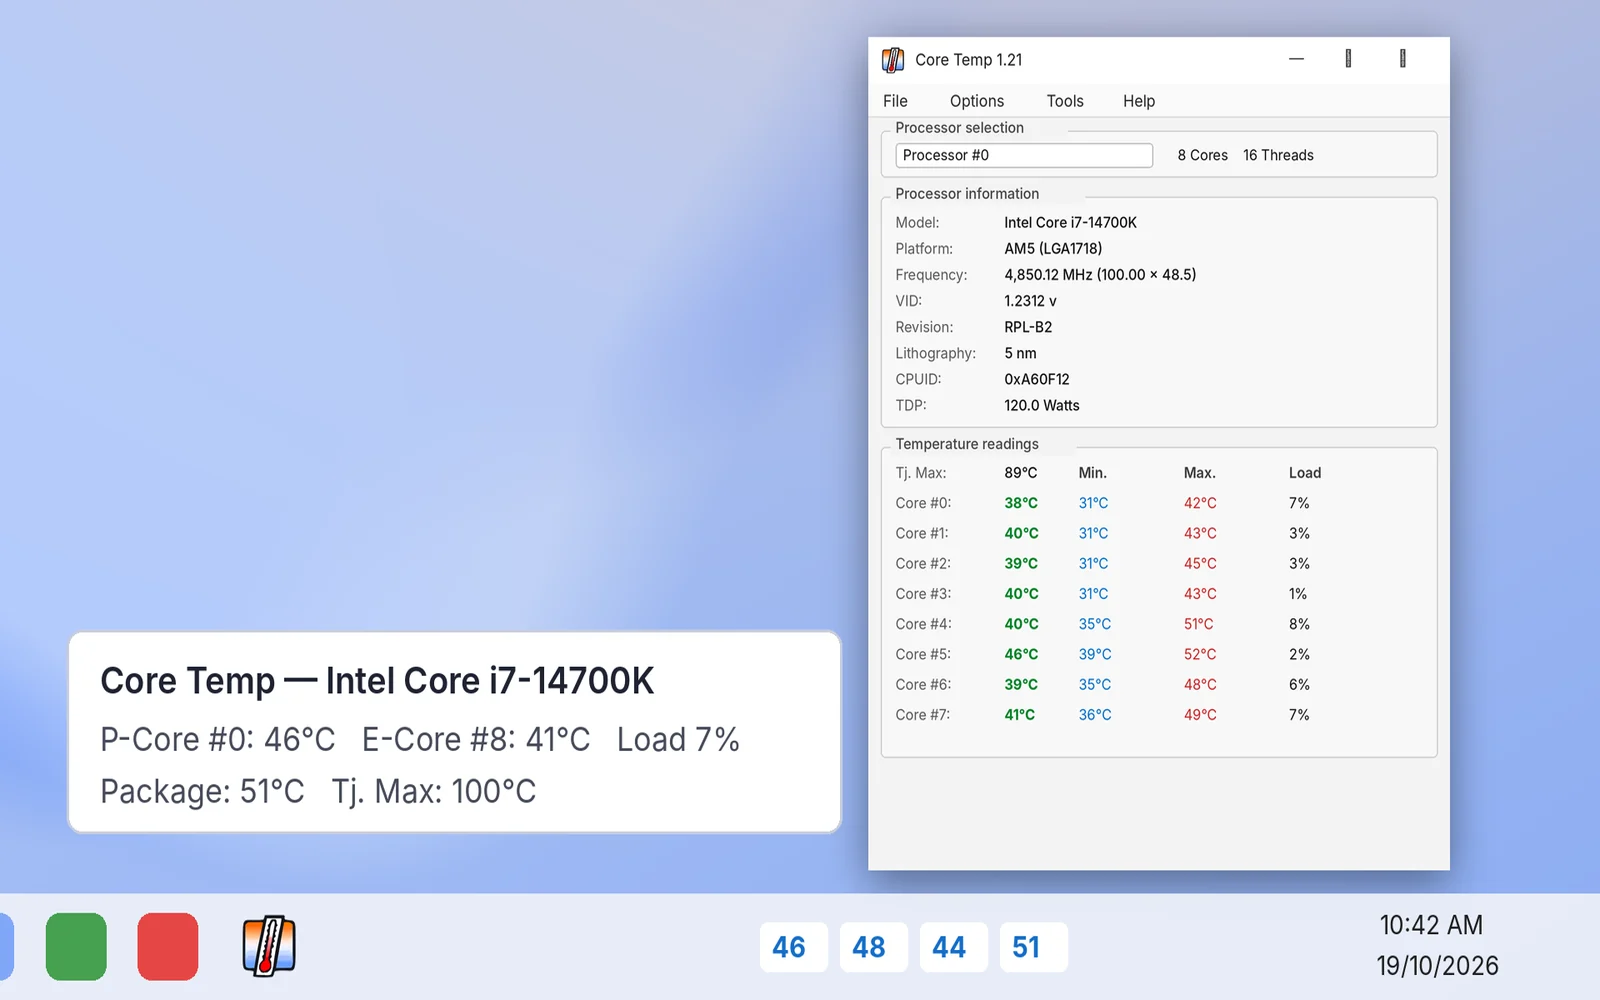
Choose whether the taskbar shows the highest temperature per processor, every core, or extra values such as frequency and load. You can colour icons by temperature. On Windows 11, also allow Core Temp under Taskbar › Other system tray icons. See Core Temp on Windows 11 for screenshots.
Logging to CSV
Enable logging on start-up in the General tab, or toggle it from the menu. Core Temp writes a comma-separated file to its program folder containing time, temperatures, load and frequency. Open it in Excel, LibreOffice or Google Sheets and insert a line chart to see trends. Gamers will find a worked example in Core Temp for gaming.
Overheat Protection
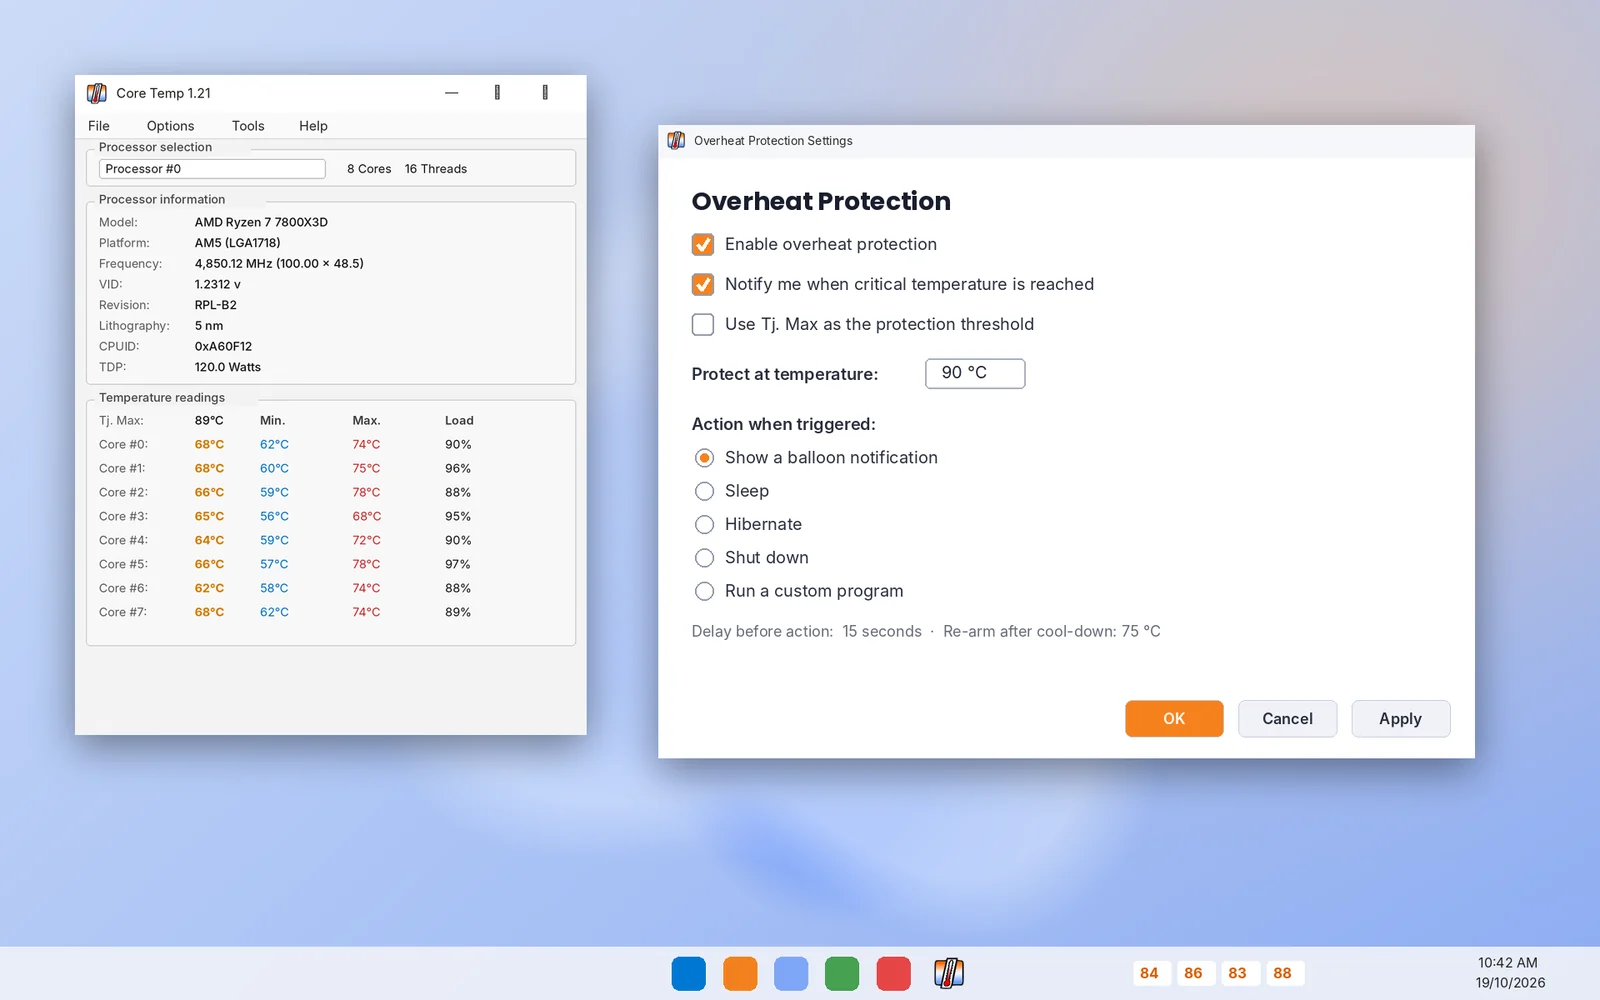
Open the Overheat Protection settings to enable it. You can trigger at Tj. Max or at a custom temperature, and choose an action: a notification, sleep, hibernate, shutdown or running a custom program. Set a short delay so brief spikes do not trigger it. This is ideal for unattended renders or laptops with ageing fans.
Plugins & Integrations
Core Temp supports plugins placed in its Plugins folder, such as a remote server that lets the Android companion app read your PC's temperatures. Developers can also read Core Temp's shared-memory interface to build widgets, overlays or automation scripts. Install only plugins from the developer's site or sources you trust.
Troubleshooting
- No readings: update to the latest version and run as administrator.
- Icons missing: enable them in Core Temp and in Windows taskbar settings.
- High temperatures: follow our overheating fix guide.
- Security warnings: verify the hash and read our safety review.
Still need help? Browse the FAQ or contact us.